Grain buyers don’t pay for yield; they pay for quality. Yet, until recently, farmers learned the quality of most of their harvest only after the fact—at the elevator or in lab tests that represent a handful of loads out of thousands of tons. A quiet but consequential shift is underway: on-combine grain analyzers now map protein, oil, starch, and moisture in real time across every pass of the field. The resulting quality maps are changing how growers plan nitrogen, segregate grain, manage storage risk, and negotiate prices—often in the same harvest season.
From lab test to live map: how it works
Modern systems mount near-infrared (NIR) spectrometers or optical sensors in the clean grain elevator of a combine. As grain flows past a measurement window, the device scans a portion of kernels multiple times per second. Each scan is converted into compositional estimates—typically protein (for wheat and barley), oil (for canola/rapeseed and soy), starch (for corn), and moisture—using calibration models built from ground-truth lab results.
Key steps in the process include:
- Sampling: A bypass or windowed cell exposes flowing grain to infrared light. Multiple measurements per second reduce noise and help average out variability.
- Calibration: Empirical models link spectra to known lab values. Robust calibrations require seasonal updates and local samples covering the expected range of varieties and conditions.
- Geo-referencing: Each quality reading is timestamped and matched to a GPS position and combine speed, producing a geo-spatial layer similar to a yield map.
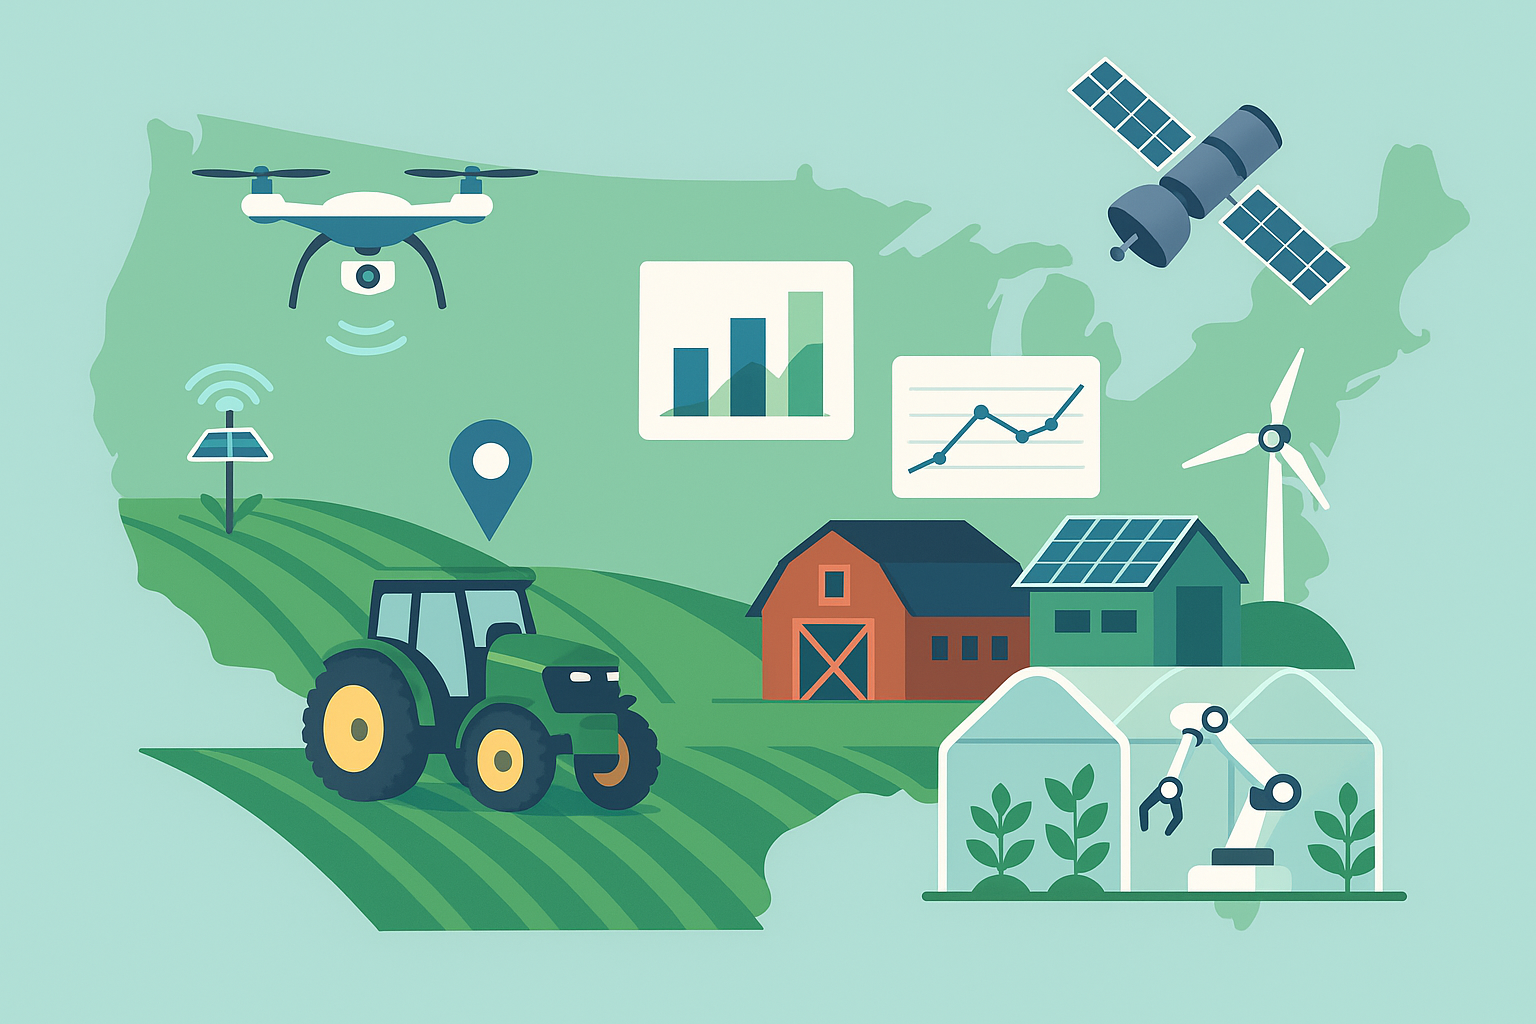
- Data handling: Readings stream to the in-cab terminal and often to the cloud over cellular links. Files export in common formats (e.g., shapefile, GeoJSON, ISO 11783 task data) for agronomy software.
By the end of a field, a grower can see both yield and quality surfaces—where the combine cut 10.5% protein versus 13%, or 42% oil versus 46%—with resolution often at the sub-acre level.
What quality maps reveal that yield maps can’t
Yield alone can mislead. A high-yielding zone may have diluted protein if nitrogen was limiting, while a modest-yielding ridge might show high protein because plants concentrated nitrogen in fewer kernels. Overlaying quality with yield exposes the underlying constraints.
- Nitrogen diagnosis in cereals: A common heuristic uses the relationship between yield and protein to infer nitrogen sufficiency. Zones with high yield and high protein often indicate adequate nitrogen and water; high yield but low protein suggests nitrogen-limited yield; low yield but high protein hints at water or heat stress rather than nitrogen deficiency.
- Profit mapping, not just production mapping: When quality affects price—think high-protein milling wheat, malting barley specs, or canola oil bonuses—profit can peak in zones that aren’t the highest yielding. Quality maps enable more accurate gross margin analysis.
- Storage and spoilage risk: Moisture maps help route wet loads to dryers or specific bins. Targeted aeration strategies reduce energy use and spoilage risk by focusing on wet pockets rather than entire bins.
Immediate payoffs at harvest
The most visible benefit is smarter segregation. Instead of blending everything, a grower can:
- Fill separate bins by quality band. For example, route passes above 13% protein to one bin to capture a premium, and keep 11–12% protein for feed markets.
- Blend on the fly. If the contract target is 12.5% protein, a grower can mix sections of higher and lower protein in controlled ratios to hit the spec and avoid discounts.
- Direct trucks. Dispatch instructions can shift in real time as the map updates, sending desirable segments to preferred buyers and keeping marginal loads on-farm or for alternative markets.
These tactics can convert quality variation from a liability into an asset, often producing new revenue in the very first season of use.
Setting next season’s nitrogen with more precision
Quality maps sharpen variable-rate nitrogen (VRN) decisions. A typical workflow is to create a four-quadrant matrix from yield (high/low) and protein (high/low):
- High yield + low protein: Likely nitrogen-limited. Increase N rates or adjust timing (e.g., split application, late-season topdress) to lift protein without over-applying elsewhere.
- High yield + high protein: Near-optimal nitrogen relative to water; small adjustments or maintenance rates.
- Low yield + high protein: Water- or heat-limited zones; extra nitrogen won’t boost yield and may push lodging or leaching. Consider soil amendments, residue management, or drought-tolerant varieties instead.
- Low yield + low protein: Multiple constraints; investigate pH, compaction, drainage, disease, or nutrient interactions before adding nitrogen.
Because the maps are spatially explicit, they guide micro-zonal strategies—changing not only how much nitrogen is applied, but when and in what form. Over time, this can improve nitrogen use efficiency while stabilizing protein and yield.
What the technology can (and can’t) measure
NIR-based systems are strong at quantifying broad compositional traits tied to molecular bonds that absorb infrared light—protein, oil, starch, moisture. They are not a substitute for all quality assessments. Falling number, DON/mycotoxins, and baking/malting functionality typically require specialized lab tests. For those, on-combine data is best seen as a high-resolution screen that guides sampling and segregation rather than a definitive certification.
Accuracy depends on calibration quality, sample representativeness, and maintenance:
- Calibrations must match locality, varieties, and the season’s range. Periodic check samples keep drift in check.
- Low-flow or stop-start conditions can bias readings; smoothing algorithms and minimum-flow thresholds help.
- Dust and chaff on optics degrade signal. Regular cleaning and self-check routines are essential in peak harvest.
Economics and ROI
Costs vary by brand and configuration, but the return paths are consistent:
- Premium capture and discount avoidance: Segregating high-protein or high-oil zones can convert mixed-load discounts into premiums.
- Input optimization: VRN informed by protein maps often trims nitrogen where it doesn’t pay and maintains or raises it where it does.
- Storage efficiency: Moisture-directed drying reduces energy bills and shrink losses.
Payback can arrive within one or two harvests on quality-sensitive crops and in regions where buyers post clear premiums. In commodity markets with narrow spreads, the value leans more on input efficiency and risk reduction than price bumps.
Data pipelines and ownership
Most systems integrate with existing combine displays and farm data platforms. Look for:
- Export flexibility: Ability to output maps as shapefiles, GeoJSON, or ISO 11783 task files ensures compatibility with agronomy tools.
- User control: Clear terms on data ownership, sharing permissions with advisors or buyers, and offline access when connectivity is weak.
- Traceability options: Some growers share quality layers with buyers to support identity-preserved contracts or sustainability claims. Ensure only necessary fields and metadata are shared.
Practical adoption checklist
- Start with one combine and one crop: Wheat or barley for protein, canola/rapeseed for oil, soy or corn for moisture/oil/starch.
- Gather local calibration samples: Pull grab samples from representative passes early in harvest and send them for lab analysis to tighten the model.
- Confirm GPS accuracy and time sync: Quality maps are only as good as their geo-referencing. Validate that timestamps, GPS, and yield data align.
- Plan bin logistics in advance: Identify which bins or trucks will take high- versus low-quality streams before the first field.
- Clean and verify daily: Wipe optics, run a quick check sample, and watch for flatlines or sudden shifts that indicate fouling.
- Close the loop: After harvest, use the yield–quality matrix to refine next season’s nitrogen strategy with your agronomist.
Where the technology is heading
Capabilities are expanding in three directions:
- Smarter calibrations: Cloud-connected models that learn from pooled, anonymized datasets can adapt to variety and seasonal shifts faster, while on-machine references reduce drift.
- Richer sensing: Combining NIR with hyperspectral or imaging systems may improve specificity and enable kernel-by-kernel assessments in the future.
- Market integration: Seamless links from the combine to buyer portals could auto-generate delivery tickets based on real-time spec compliance, tightening traceability while preserving grower control over data.
As quality layers become as routine as yield maps, the center of gravity in crop management tilts from producing tons to producing spec-compliant tons at the lowest risk and cost. That shift favors farms that treat data as an operational asset—measured accurately, acted on promptly, and connected to the markets that reward it.